IGNOU BCA(4) BCS-040 Statistical Techniques Solved Assignment 2019-20
Course Code: BCS-040
Course Title: Statistical Techniques
Assignment Number: BCA(4)/040/Assignment/2019-20
Maximum Marks: 100
Weightage: 25%
Last Date of Submission: 15th October 2019 (For July 2019 Session)
15th April 2020 (For January 2020 Session)
Note: This assignment has 16 questions of 80 marks (each question carries equal marks). Answer all the questions. Rest 20 marks are for viva voce. You may use illustrations and diagrams to enhance explanations. Please go through the guidelines regarding assignments given in the Programme Guide for the format of the presentation.
To get the full solved assignment of BCS-040 Statistical Techniques (2019-20), Click Here
IGNOU BCA Solved Assignment 2019-20
IGNOU BCA 1st Semester Solved Assignment 2019-20
IGNOU BCA 2nd Semester Solved Assignment 2019-20
IGNOU BCA 3rd Semester Solved Assignment 2019-20
IGNOU BCA 4th Semester Solved Assignment 2019-20
IGNOU MCA Solved Assignment 2019-20
Q1. A research was conducted to improve the safety plans in a factory. In this study, the accidental data of the factory for the last 50 weeks were compiled. These data are grouped into the frequency distribution as shown below:
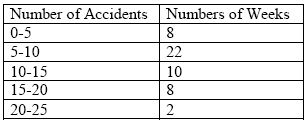
Draw a histogram and calculate the average number of accidents per week.
Q2. A cricket ball manufacturing company wants to check the variation in the weight of the balls. For this, 25 samples each of size 4, are selected and the weight of each ball is measured (in grams). The sum of the sample average and the sum of Sample ranges were found to be Grams and
grams, respectively. Compute the control limits for the X and R-charts. It is given that
,
and
.
Q3. An insurance company insured 1000 scooter drivers, 3000 car drivers, and 6000 truck drivers. The probabilities that the scooter, car and truck drivers meet with an accident are 0.2, 0.04 and 0.25 respectively. One of the injured persons meets with an accident. What is the probability that he is a car driver ?
Q4. A researcher would like to test whether there is any significant difference between the proportion of safety consciousness of men and women while driving a car. In a sample of 300 men, 130 said that they used seat belts. In a sample of 300 women, 90 said that they used seat belts. Test the claim that there is no significant difference between the proportion of safety consciousness of men and women while driving a car at 5% level of significance. (Given that )
Q5. A company manufactures two types of bulbs, (A and B). The manager of the company tests a random sample of 50 bulbs of type A and 60 bulbs of type B and obtains the following information:
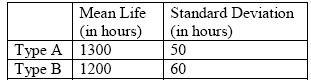
Obtain 99% confidence interval for the difference of the average life of the two types of bulbs. (Given that )
To get the full solved assignment of BCS-040 Statistical Techniques (2019-20), Click Here
Q6. A washing machine company chooses a random sample of 10 motors received from one of the suppliers. It determines the length of life of each of the motors. The results (in thousands of hours) are as follows:
4.5, 5.0, 4.2, 4.8, 4.2, 5.1, 4.0, 4.2, 4.2, 4.5
Compute a point estimate of the mean length of life of the motors received from the supplier.
Q7. A steel rod is subjected to stress. The tensile strength of the rod at different values of the stress are recorded. Find a relation between the tensile strength and the stress. The data is given below:
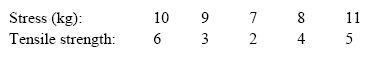
Also, predict the tensile strength at a stress of 5 kg.
Q8. A computer engineer identifies four ways that a certain job can be done. To determine how long it takes operators to do the job when each of these methods is used, the engineer asks four operators to do the job using the method A, another four operators to do the job using method B, and so on. Each operator’s time (in seconds) is shown below:
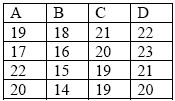
Construct the relevant analysis of variance table and test the hypothesis that the average time of all operators are equal at 1% level of significance. (Given that )
Q9. The following contingency table presents the analysis of 300 persons according to hair colour and eye colour:
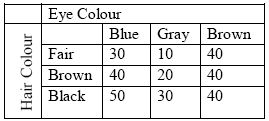
Test the hypothesis that there is an association between hair color and eye colour at 5% level of significance. (Given that )
To get the full solved assignment of BCS-040 Statistical Techniques (2019-20), Click Here
Q10. Suppose an analyst studies three villages having population ,
and
, respectively. A stratified random sample is to be taken with a total sample size of n = 500. Determine the sample size to be selected from each village individually using the method of (i) proportional, and (ii) optimal allocation. From the previous survey, it is known that the standard deviations are
,
and
.
Q11. A company wants to estimate, how its monthly costs are related to its monthly output rate. The data for a sample of nine months is tabulated below :
![]()
Using the data given above, perform the following tasks :
(a) Calculate the best linear regression line, where the monthly output is the dependent variable and monthly cost is the independent variable.
(b) Use the regression line to predict the company’s monthly cost, if they decide to produce 4 tons per month.
Q12. The Probability that at least one of the two Independent events occur is 0.5. Probability that first event occurs but not the second is . Also, the probability that the second event occurs but not the first is
. Find the probability that none of the two event occurs.
Q13. Marks of six students are tabulated below:
![]()
From the population, tabulated above, you are supposed to choose a sample of size two.
(a) Determine, how many samples of size two are possible
(b) Construct sampling distribution of means by taking samples of size 2 and organize the data.
Q14. Explain the following with the help of an example each:
(a) Goodness of fit test
(b) Criteria for a good estimator
(c) Test of Independence
(d) ANOVA
Q15. Compare the following
(a) Cluster sampling, Stratifies sampling, and Systematic sampling
(b) Parametric and Non-Parametric Tests
Q16. What are control charts briefly discuss the utility of control charts?
To get the full solved assignment of BCS-040 Statistical Techniques (2019-20), Click Here
IGNOU BCA Solved Assignment 2019-20
IGNOU BCA 1st Semester Solved Assignment 2019-20
IGNOU BCA 2nd Semester Solved Assignment 2019-20
IGNOU BCA 3rd Semester Solved Assignment 2019-20
IGNOU BCA 4th Semester Solved Assignment 2019-20
IGNOU MCA Solved Assignment 2019-20
Thank You
Contact Us:
Email Address: susanta4friends@gmail.com
WhatsApp no.: 7980608289
Question no. 8 numericals give me solution for statistical techniques.