
BCSL-044 Solved Assignment 2021-22
BCSL-044 Solved Assignment 2021-22
| Subject Name | Statistical Techniques Lab |
| Assignment Code | BCSL-044 |
| Session | 2021-2022 (July – January) |
| File Type | |
| Number of Pages | 29 |
| Price | Rs. 45 |
To get the PDF click on the button below.
Pay Now
Note:
|
Statistical Techniques Lab (BCSL-044) 2021-2022 (July-January)
Note: There are six questions in this assignment, which carries 40 marks. Rest 10 marks are for viva-voce. Answer all the questions. Please go through the guidelines regarding assignments given in the Programme Guide for the format of presentation. All the following questions must be performed using a statistical package. You may use any statistical package for this purpose.
Question 1: Height of the students of a class of 40 students was recorded. This data is given in the following table. Perform the tasks given in (i) to (iv) on the data given below using a spreadsheet package: (6 Marks)
(Height in Cms)

(i) Find the minimum and maximum height using the spreadsheet formula.
(ii) Create 6 classes with suitable class intervals and create the frequency distribution. You must use Array formula.
(iii) Find the percentage of the students whose height is less than the mean height. Also find outlier in the data, if any.
(iv) Draw the histogram for the data given in the table above. Is the data distribution normal distribution?
BCSL-044 Solved Assignment 2021-22
BCA 4th Sem Solved Assignment 2021-22
BCA 4th Sem Assignment 2021-22 Question PDF
Question 2: Perform the following tasks using spreadsheet software (you may use spreadsheet function for computing the value of t): (6 Marks)
(i) Find the value of t for the given value of degree of freedom and significance level (alpha):
| Degree of freedom | Significance |
| 24 | 0.10 |
| 10 | 0.05 |
(ii) A company manufactures flour packets of 5 kg weight. A sample of 20 such flour packets were taken out of a lot consisting of 500 flour packets. The mean sample weight was found to be 5.150 kg having a standard deviation of 0.215 kg. Assuming random sampling and a confidence level of 95%, will you accept the flour packets. Justify your answer. You should perform all computations using a spreadsheet software. Make suitable assumption, if any.
BCSL-044 Solved Assignment 2021-22
BCA 4th Sem Solved Assignment 2021-22
BCA 4th Sem Assignment 2021-22 Question PDF
Question 3: A hardware company produces IC chips; the length of each chip is required to be exactly 50 mm. The company has four different machines to produce these IC chips. Each day five samples of each machine are taken and the length of these IC chips is measured. The following tables lists these details: (10 Marks)
The length of IC chips (in mm)
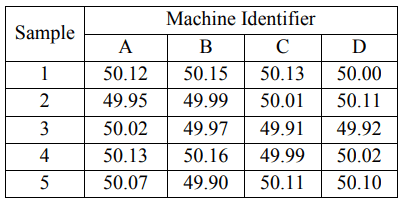
Perform an ANOVA using any software to test (at 5% level) whether all the four machines are producing the IC chips with correct length. Justify your findings. Make suitable assumptions, if any.
BCSL-044 Solved Assignment 2021-22
BCA 4th Sem Solved Assignment 2021-22
BCA 4th Sem Assignment 2021-22 Question PDF
Question 4: The rainfall in the first 15 days of August, 2021 is shown in the following table. Use spreadsheet software to find the moving averages for the length of 5 and 7. Also draw suitable graphs of these moving averages. (6 Marks)

Question 5: A company packs nuts in a packet of 1 kg. The quality of process of producing the packets of nuts is controlled statistically. To do so, sample of five packets is taken at four different times of the day. Calculate the control limits for mean and range; and plot the control charts using any statistical software. Make suitable assumptions, if any. (6 Marks)
The data is given in the following table:
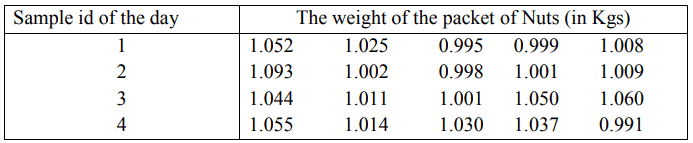
(Please take suitable values of d2 , d3, d4 , A2 and other variables.)
BCSL-044 Solved Assignment 2021-22
BCA 4th Sem Solved Assignment 2021-22
BCA 4th Sem Assignment 2021-22 Question PDF
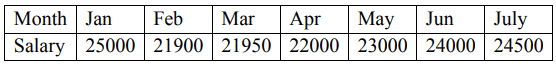
Question 6: The following table shows the increase in the average salary of the employees of an organization. Fit a trend line using any statistical software to this sales data. Make suitable assumptions. (6 Marks)
BCSL-044 Solved Assignment 2021-22
BCSL-044 Solved Assignment 2021-22